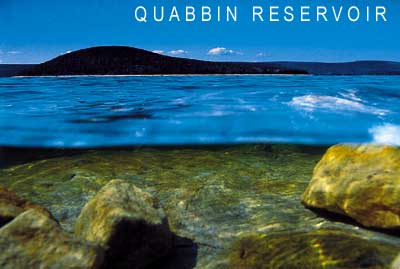
We had a special visit from Mrs. Meg Tabaksco from the MWRA (Massachusetts Water Resources Authority). She talked with our class about how our water gets to us in Watertown. We learned that in the 1930's, people built a giant reservoir to hold water for the communities near Boston. They had to move 4 entire towns!
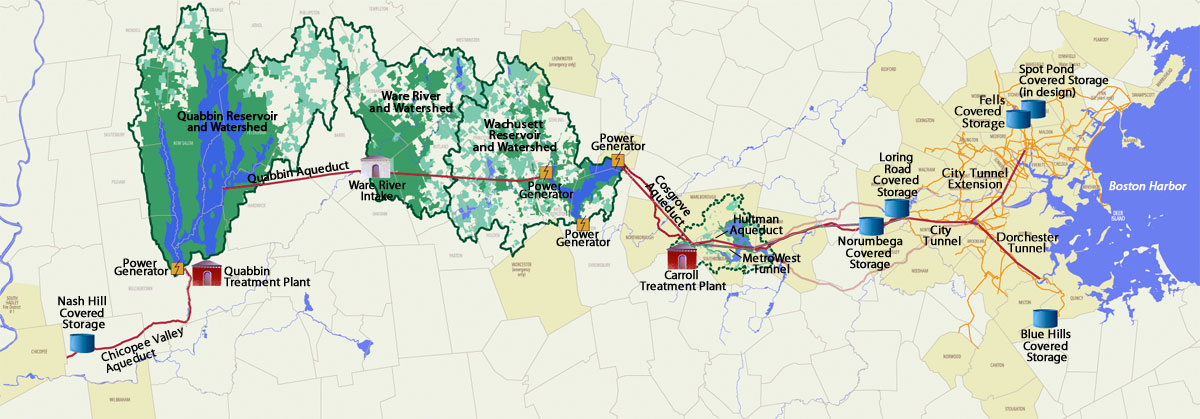
Water from rain and streams collects in the Quabbin Reservoir. From there, it is piped in giant pipes all the way to us, where local water mains bring it to buildings everywhere in our city. Along the way, it is treated to make it safe to drink, and they add floride to help keep our teeth healthy.
We listed many kinds of buildings that use water:
- schools
- hospitals
- police stations
- fire stations
- resturaunts
- grocery stores
- pet stores
- hotels
- motels
- houses
- laundromats
- sports stadiums
- and more!
We drew a giant picture to show how the water all connects through a series of pipes back to the Quabbin.
Visit these pages at the MWRA to learn more about the pipes and distribution system:
- How the MWRA System Works
- New Metrowest Water Supply Tunnel
Thank you, Mrs. Tabaksco!
Hard at work

Monday, December 17, 2012
The Lowell Lizard
We have started a new tradition in Room 204. To recognize all of the good things that we do for one another, we are sharing the Lowell Lizard. Every two days, the person who has been holding it gives it to another classmate, naming the kind thing that person did. When it is your turn to have the lizard, you get to hold it during meeting times on the rug and you can have it with you when you read or work.
So far, three people have had it. These three people have been recognized for the small kindnesses they have shown. One person complimented another's careful workmanship. Another helped someone when they felt sad.
What is a kind thing that you have done?
Monday, December 3, 2012
Rolling the Dice
In math today, we played a new game with dice. We rolled two dice. One was a normal die, with the numbers 1, 2, 3, 4, 5, and 6. The other die had the numbers 7, 8, 9, 10, 11, and 12 on it. Every time we rolled the dice, we added the two numbers together. We kept track of which ones we rolled with a bar graph, to see which one we rolled the most.
At the end of math, we put all of our data together to make a class graph of our results. We learned that the best way to test probability is to get lots of information, lots of data.
We had a few questions.
Why were there no 7's?
Why are the numbers in the middle the most likely sums?
At the end of math, we put all of our data together to make a class graph of our results. We learned that the best way to test probability is to get lots of information, lots of data.
| Number Race Class Results | ||||||||||||||||||||||||||||||||
| 7 | ||||||||||||||||||||||||||||||||
| 8 | x | x | x | x | x | x | x | x | x | x | ||||||||||||||||||||||
| 9 | x | x | x | x | x | x | x | x | x | x | x | x | ||||||||||||||||||||
| 10 | x | x | x | x | x | x | x | x | x | x | x | x | x | x | x | x | x | x | x | x | ||||||||||||
| 11 | x | x | x | x | x | x | x | x | x | x | x | x | x | x | x | x | x | x | x | x | x | x | x | x | x | |||||||
| 12 | x | x | x | x | x | x | x | x | x | x | x | x | x | x | x | x | x | x | x | x | x | x | x | x | x | x | x | x | x | x | x | x |
| 13 | x | x | x | x | x | x | x | x | x | x | x | x | x | x | x | x | x | x | x | x | x | x | x | x | x | x | x | x | x | |||
| 14 | x | x | x | x | x | x | x | x | x | x | x | x | x | x | x | x | x | x | x | x | x | x | x | x | x | x | x | x | x | x | x | |
| 15 | x | x | x | x | x | x | x | x | x | x | x | x | x | x | x | x | x | x | x | x | x | x | x | x | ||||||||
| 16 | x | x | x | x | x | x | x | x | x | x | x | x | x | x | x | x | x | |||||||||||||||
| 17 | x | x | x | x | x | x | x | x | x | x | x | x | x | |||||||||||||||||||
| 18 | x | x | x | x | x | x | ||||||||||||||||||||||||||
Why were there no 7's?
Why are the numbers in the middle the most likely sums?
Subscribe to:
Posts (Atom)


